Economic Data Exposes Scale of Unlicensed Platforms' Worldwide Operations
Written by Harper Perry · Aug 16, 2026

Economic Data Exposes Scale of Unlicensed Platforms' Worldwide Operations
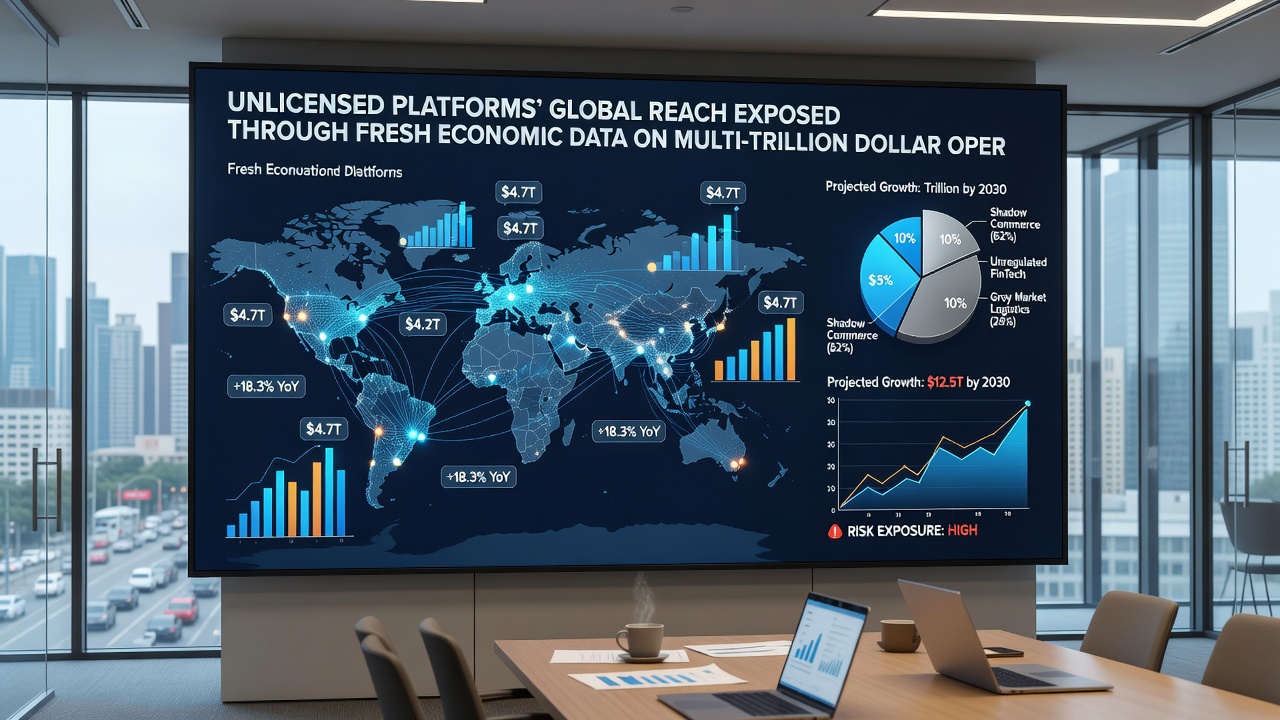
Economic analyses released in August 2026 have drawn attention to the expansive footprint of unlicensed digital gaming platforms, with aggregate transaction volumes now estimated in the multi-trillion dollar range according to cross-border financial tracking studies. These platforms operate outside established regulatory frameworks in multiple jurisdictions, and the latest figures compile transaction logs, payment processor records, and market surveys from regions spanning Asia, Latin America, and Eastern Europe. Observers note that the data sets integrate inputs from central banks and tax authorities, revealing patterns of sustained growth even as enforcement actions continue in select markets.
Payment flows tracked through cryptocurrency channels and alternative processors account for a substantial share of activity, while traditional banking routes still handle portions of the volume in jurisdictions with lighter oversight. Researchers compiling the 2025 baseline data identified clusters of high-volume servers located in Southeast Asia and parts of Africa, where licensing requirements remain minimal or unenforced. The resulting estimates place annual handle figures well above previous projections, driven by mobile access and localized language interfaces that expand user bases rapidly.
Regional Patterns in Transaction Volumes
Data compiled by the Australian Institute of Criminology shows pronounced activity in the Asia-Pacific corridor, where unlicensed sites capture significant shares of player spending that would otherwise route through regulated operators. Similar patterns appear in South American markets, where economic volatility encourages shifts toward digital alternatives that bypass local currency controls. North American figures remain lower overall yet demonstrate steady cross-border participation, particularly through offshore servers serving users in states without full regulatory rollout. These geographic distributions illustrate how platform operators adapt server locations and marketing approaches to maintain continuity despite periodic domain seizures.
But here's the thing: enforcement varies sharply by region, allowing certain networks to sustain operations for years while others face repeated disruptions. Financial intelligence units in the European Union have reported rising volumes of suspicious activity reports tied to unlicensed sites, prompting enhanced monitoring of high-risk payment corridors. Meanwhile, operators in less regulated zones leverage affiliate programs and targeted advertising to offset losses from blocked domains.
Payment Infrastructure and Scale Indicators
Transaction monitoring from multiple clearing houses indicates that unlicensed platforms process volumes rivaling some national lotteries in aggregate size, with peak periods coinciding with major sporting events and seasonal promotions. Cryptocurrency settlements represent a growing slice, yet fiat-based methods persist where users prefer familiar withdrawal options. Studies from the UNODC highlight how layered corporate structures and offshore entities obscure ownership trails, complicating efforts to quantify exact market shares. These structures also enable rapid pivots when one payment rail faces restrictions, sustaining overall throughput even under pressure.
One analysis of 2025 transaction ledgers revealed that average session values and frequency rates in unlicensed environments often exceed those recorded in tightly regulated markets, a pattern attributed to fewer restrictions on game variety and bonus structures. Observers tracking these metrics point to integrated live dealer options and instant payout features as key retention drivers. Data sets further break down activity by device type, showing mobile dominance in emerging economies where broadband penetration continues climbing.
Challenges in Measurement and Oversight
Compiling accurate totals remains difficult because many platforms cycle through multiple domain registrations and mirror sites within short timeframes. Central bank reports from several jurisdictions now include dedicated sections on offshore gaming flows, yet gaps persist where informal value transfer systems operate outside standard reporting. Academic reviews of available ledgers suggest the true scale could exceed published estimates once additional data streams from smaller processors become accessible. Coordinated efforts among financial regulators in Canada and Australia have begun sharing anonymized datasets to refine these projections, producing more granular regional breakdowns than earlier single-source studies allowed.
What's interesting is how the August 2026 updates incorporated real-time blockchain analytics alongside traditional banking records, yielding tighter confidence intervals around the multi-trillion aggregate. These refinements also flag seasonal spikes tied to cricket tournaments in South Asia and football leagues in Latin America, underscoring the event-driven nature of much of the activity. Regulatory bodies continue exploring technological tools for pattern recognition that could improve detection without expanding physical enforcement footprints.
Conclusion
Fresh economic indicators continue to map the contours of unlicensed platform operations on a global scale, drawing from payment records, server logs, and user surveys that together paint a picture of resilient, adaptive networks. While measurement challenges persist, the August 2026 releases demonstrate incremental progress in capturing previously underreported volumes across diverse regions. Ongoing collaboration among financial intelligence units and academic researchers promises further clarity as additional data sources integrate into future models.